Org Dashboard
Get an overall picture of how your org archives
Introduction
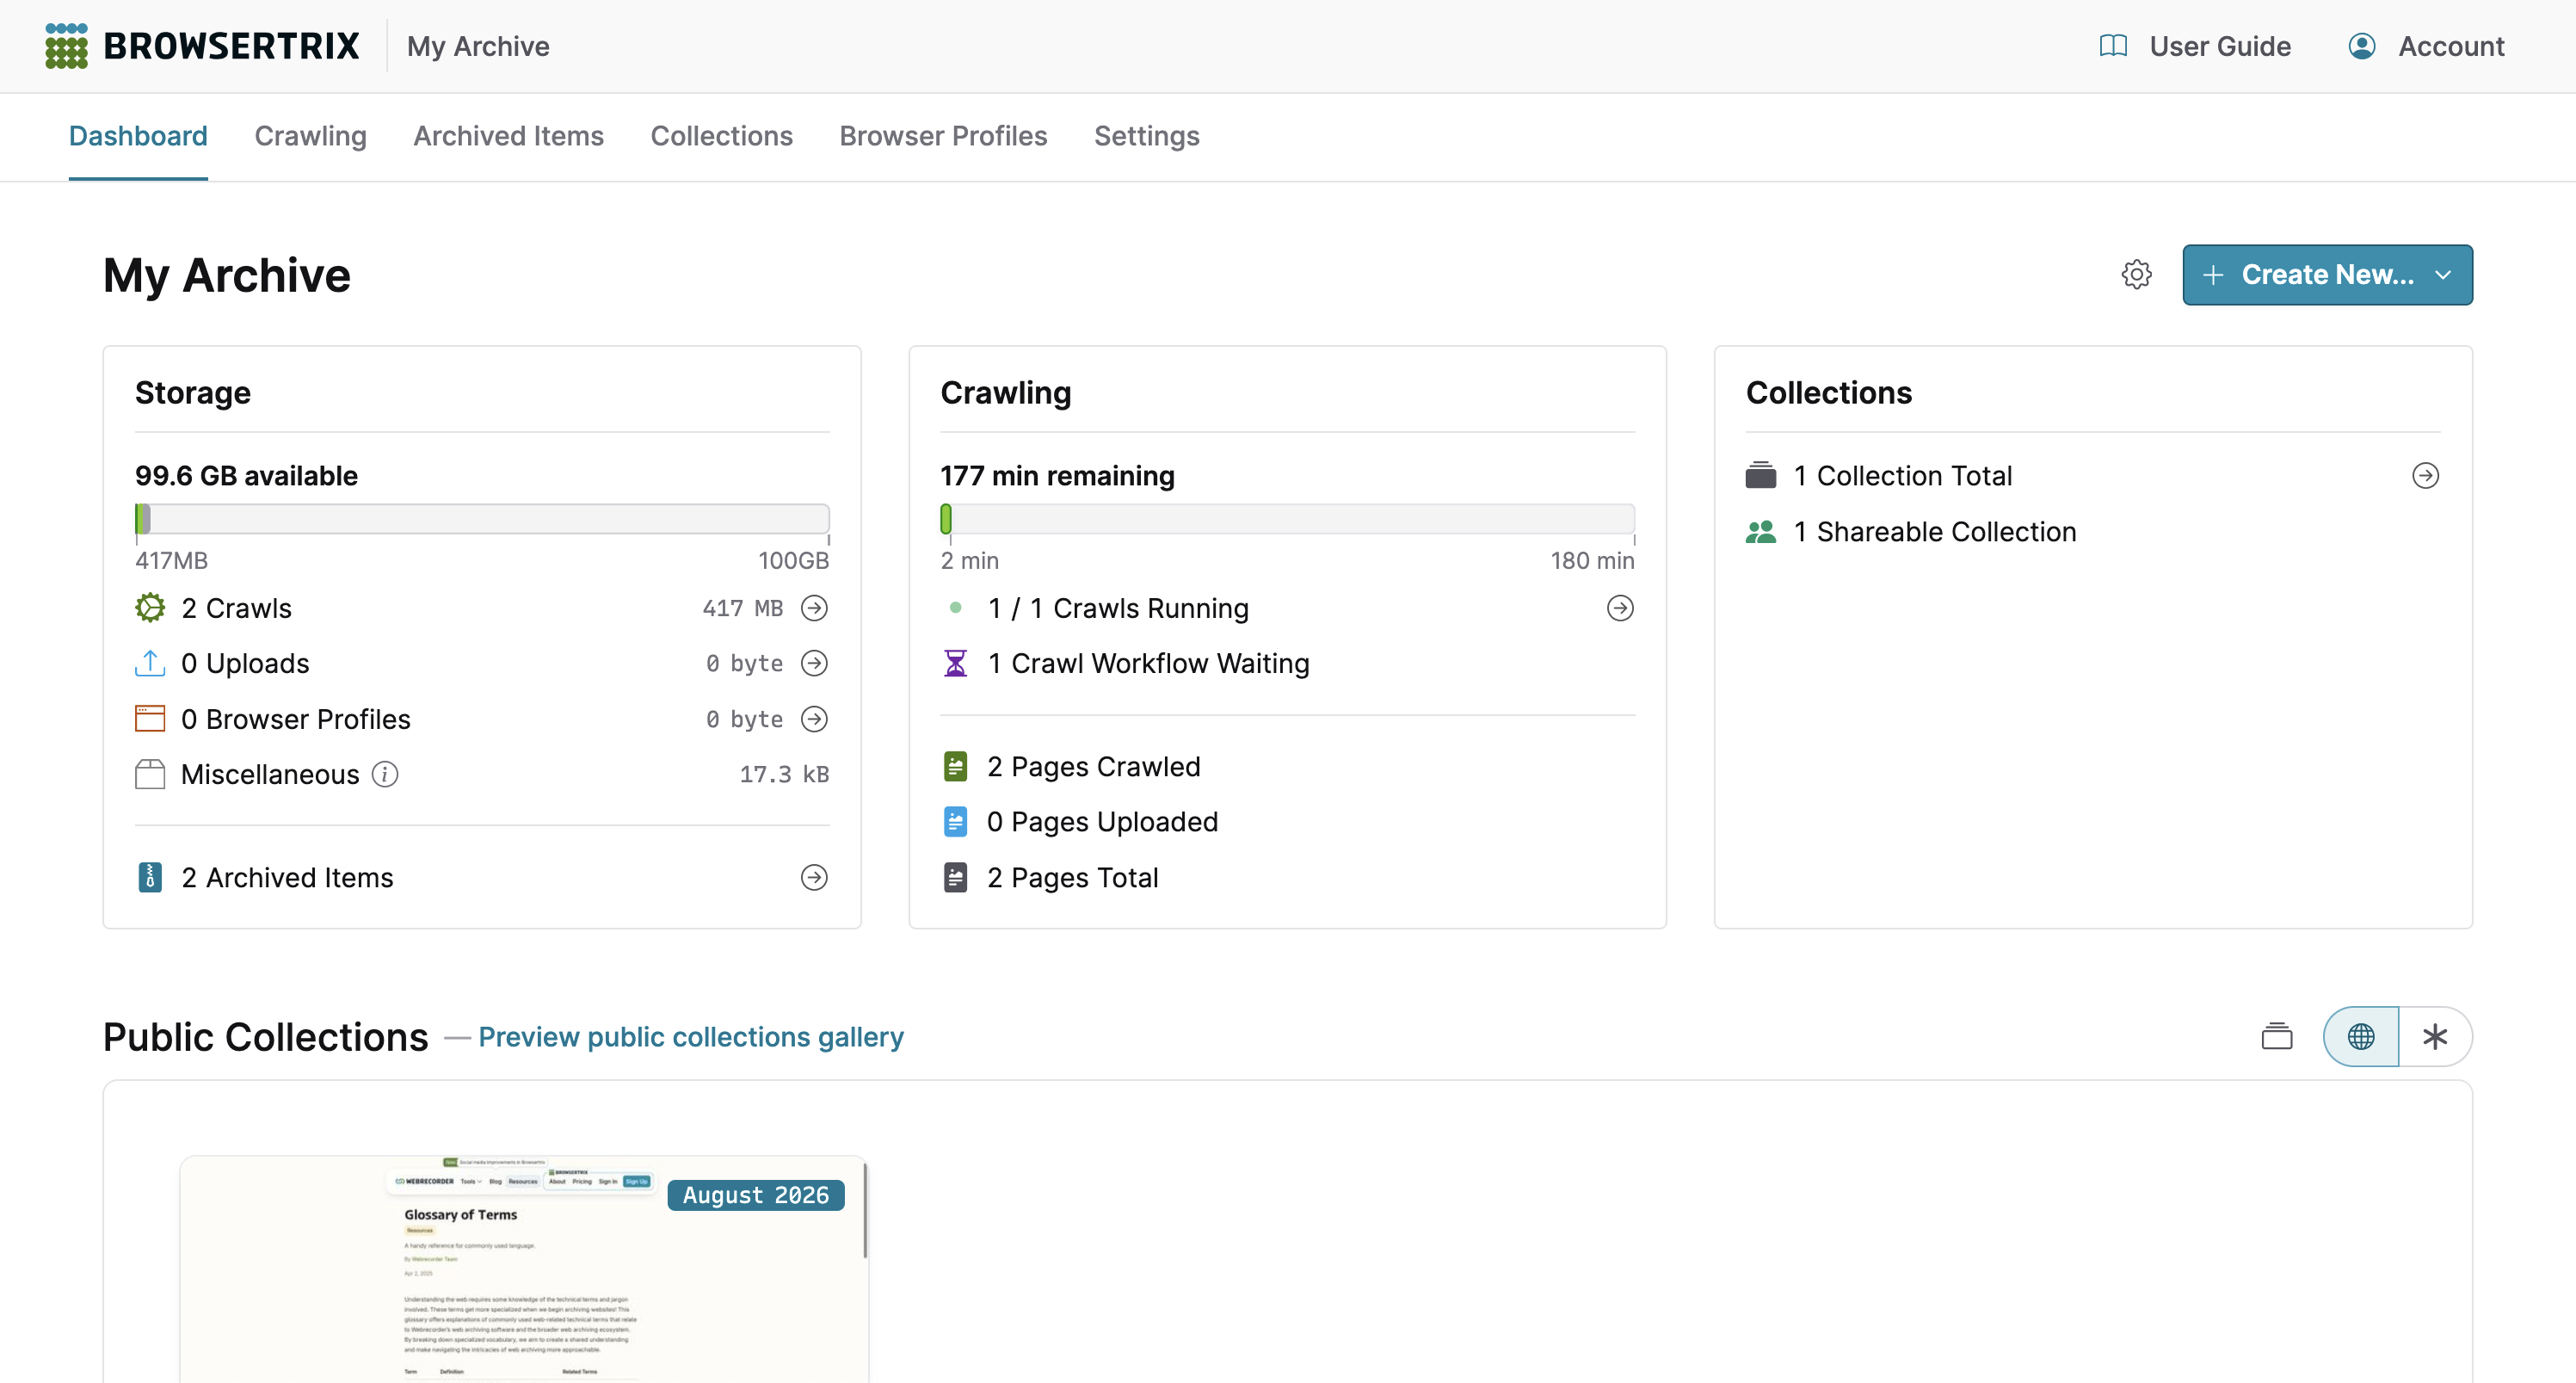
The dashboard is the first page that you see when you log in. It gives you access to essential stats and a Create New ... shortcut to quickly add a crawl workflow, collection, browser profile, or uploaded item.
Usage Stats and Quotas
Usage statistics and quotas will be visible once your org contains web archiving data.
Storage
The storage panel displays the total size and count of archived items and browser profiles.
For organizations with a set storage quota, the storage panel displays a visual breakdown of how much space the organization has left and how much has been taken up by all types of archived items and browser profiles. To view additional information about each item, hover over its section in the graph.
Miscellaneous storage
You may see an additional Miscellaneous size depending on your crawl workflow and collection configuration. Miscellaneous is the total size of all supplementary files in use by your organization, such as workflow URL list files and custom collection thumbnails.
Crawling
The crawling panel lists the number of currently running and waiting crawls, as well as the total number of pages captured.
Execution Time
Subscription Feature
For organizations with a set execution minute limit, the crawling panel displays a graph of how much execution time has been used and how much is currently remaining. Monthly execution time limits reset on the first of each month at 12:00 AM GMT.
How is execution time calculated?
Execution time is the total runtime of a crawl scaled by the Browser Windows value during a crawl. Like elapsed time, this is tracked while the crawl runs. Changing the amount of Browser Windows while a crawl is running may change the amount of execution time used in a given time period.
Collections
The collections panel displays the number of total collections and collections marked as sharable.
Public Collections
If any of org collections are public, their thumbnails will be displayed in the Public Collections section of the dashboard.